Need better instructions didnt show up... :/
From the fresh gmapsupp.img(from zip) do we need to unlock it first? to ->
Navigation chart can be seen just fine but when switched to Fishing chart it wont show up... Restricted or something msg.
Well if anyone could help thanks alot. :O
Is the problem that we do not have C:\Documents and Settings --- folder?
Only have C: / users/usernamehere/Desktop ?
Welcome guest, is this your first visit? Click the "Create Account" button now to join.
Results 11 to 20 of 21
-
8th February 2013, 06:03 PM #11

Map data are from 7-2012. Probably the newest is v.14.50 of February 2013.
Probably you posted without testing ,fishing chart is available in Homeport:Code:Please Login or Register to see the links


You have to navigate to get to the good.
Galaxy S5 Kitkat 4.4.2 / Nuvi1200->1250 / Nuvi3790T->34xx / Nuvi 2200 / Nuvi 66 / Oregon 600
-
8th February 2013, 10:35 PM #12Junior Member


- Join Date
- Jan 2013
- Location
- EU
- Posts
- 6
- Rep Power
- 0

Last edited by derath; 8th February 2013 at 11:32 PM.
-
9th February 2013, 12:07 AM #13

You got instructions by pm and are always the same:
Copy the gmapsupp.img in a Garmin directory in sd, start Homeport.Homeport read locked maps too
If you want to use it in plotter unlock it with gimgunlock.
Fishing charts are available in this map as shown in my screens above. Set in Menu/View/Chart Views/Fishing Chart
Printing restrictions are in every Garmin Bluecharts because Garmin didnt get licence for that.
Garmin does not make their own maps. They buy map data from a variety of providers. Some of these providers give the data to Garmin on condition that users can't print it.
I sent you the link for a workaround to print it.
You have to navigate to get to the good.
Galaxy S5 Kitkat 4.4.2 / Nuvi1200->1250 / Nuvi3790T->34xx / Nuvi 2200 / Nuvi 66 / Oregon 600
-
10th February 2013, 02:45 AM #14Junior Member


- Join Date
- Jan 2013
- Location
- EU
- Posts
- 6
- Rep Power
- 0

Yes i can see the map from the SD but no depth details i only see as shown here: - This is the fishing chart: [Only registered and activated users can see links. ]
I did unlock this IMG aswell.
Navigation chart shows the depth readings fine.
Garmin homeport 2.1.1
I wont get the depth readings do i need to adjust this somehow? thanks.Last edited by derath; 10th February 2013 at 02:48 AM.
-
10th February 2013, 03:39 AM #15Navigation software expert


- Join Date
- Apr 2009
- Location
- Suomi-Russia
- Age
- 58
- Posts
- 2,149
- Rep Power
- 729

Do you try to zoom in map?
I see very general picture on your picture. On this scale device not show depth spots and digits on contour. In fishing chart mode the map is overloaded by details. You must remember what in that mode the map is not draw the real data. It is artificially created map using a special algorithm and only based on the real data. Contour of depth be synthesized with maximal frequency for giving better presentation map. You must not use the fishing chart for navigation!!! It is danger!!! But for fishing it is very useful because you have a possibility to visualize the relief of water-body. As well it give me a chance to try to keep the required depth on trolling route. In this case all risk is lost valuable jig spinners Garmin, how much is 30 pieces of silver for Judas today? Were they worthy for crucifix of GPSPower?
-
10th February 2013, 05:33 PM #16

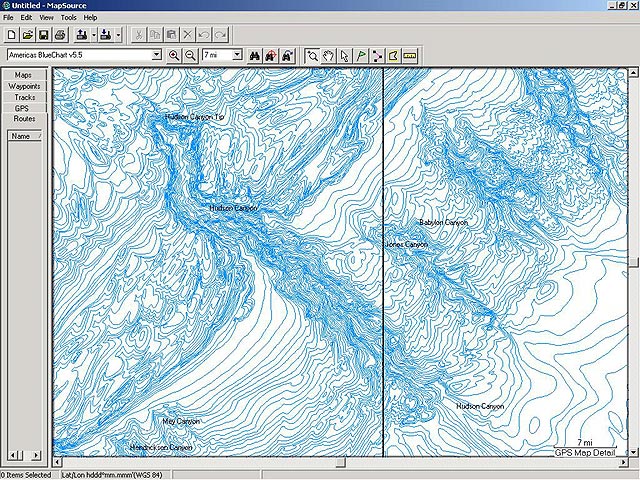
•Fishing charts to help scope out bottom contours and depth soundings with less visual clutter on the display.
Bathymetric charts include many details such as depth contours, names of local canyons, wrecks, obstructions.
Bathymetric data is intended to be used as a fishing chart and is designed for use in conjunction with traditional BlueChart data.
See for example this old MS chart:


You have to navigate to get to the good.
Galaxy S5 Kitkat 4.4.2 / Nuvi1200->1250 / Nuvi3790T->34xx / Nuvi 2200 / Nuvi 66 / Oregon 600
-
5th July 2013, 08:05 PM #17Member


- Join Date
- Jun 2012
- Location
- Germany
- Posts
- 15
- Rep Power
- 0

The files seems to be down.
-
8th July 2013, 11:36 AM #18
-
8th July 2013, 04:34 PM #19Junior Member


- Join Date
- Jul 2013
- Location
- finland
- Posts
- 1
- Rep Power
- 0

Hi, Map version would be nice to have, but link made by N8 won`t work
Note by MOD: Catymag mean at post number 8 has updated linkLast edited by kenta2; 8th July 2013 at 05:04 PM. Reason: added note
-
8th July 2013, 05:03 PM #20


 Likes:


 Reply With Quote


Bookmarks